

Designing dashboards for mobile isn’t just about visuals — it’s about communicating data clearly in limited space, with all the unpredictable realities of real-world data.
This Figma widget set was built to help with exactly that.
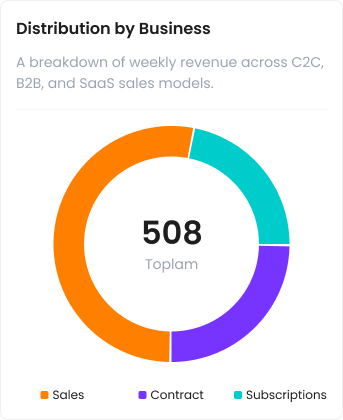
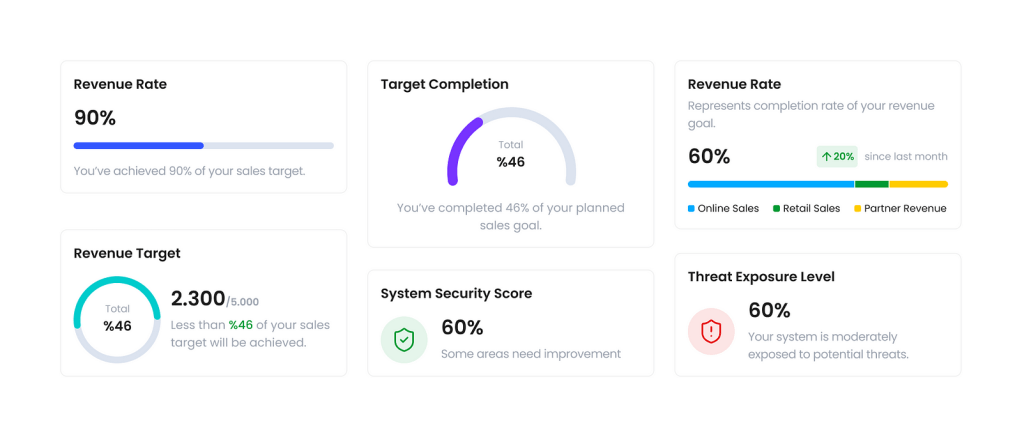
It includes mobile-ready components like percentage cards, progress gauges, security indicators, and risk scores — each with built-in logic for edge cases, empty states, and microcopy that explains what the data actually means.
Dashboards often fall short in practice because they assume the data will always be ideal. But what if the sales target is undefined? What if the user has no data yet? What does 0%, 46%, or 100% really mean to a user?
Instead of ignoring those questions, these components respond to them. Each one is:
- Mobile-sized and responsive
- Includes default, loading, and empty states
- Uses clear, concise language
- Visualizes not just numbers but meaning
Widgets like:
- Revenue Rate show performance at a glance
- Target Completion gives a visual sense of how far a goal has progressed
- System Security Score indicates how well your platform is protected
- Threat Exposure Level flips that logic to highlight your risk instead
They’re simple, reusable, and adaptable — but more importantly, they respect the complexity of real-world UX.
Lets Meet at Figma !

Yorum bırakın